ENG
Scroll
-
Overview Brochure Test methodology Clinical data Technical report Sample report TRF FORM
Provider
-

01 BEBEGENE analysis
The genomic wave pattern in the Illumina's Global Screening Array (GSA) chip was confirmed using 5,399 clinical samples. Autosomal chromosomes were divided into 1 Mb bin, and LRR mean and standard deviation (SD) of markers within the region were calculated. Bin with no markers or LRR SD 8 0.05 were excluded from the analysis because small SDs result in even distribution and are not very useful for analysis.
5,399 samples were clustered using the k-means method [Figure 3, 4]. The cluster name was indicated on the classified samples, and the mean was calculated for the marker LRR included in the bin for samples in the cluster. The samples in each cluster were plotted with the mean, and cluster patterns were confirmed.
For the sample feature to be used for classification, the LRR mean for the 238 regions used for k-means5-7 analysis was calculated and classified using k-Nearest Neighbor (k-NN)8-10. The matched cluster sample LRR data were used to normalize into the Z-score. Since the range of normalized values is different from the original LRR, adjustment to the original range is necessary. The original LRR SD and Z-score SD were resized to a similar value to create a new LRR called modified LRR (mLRR).
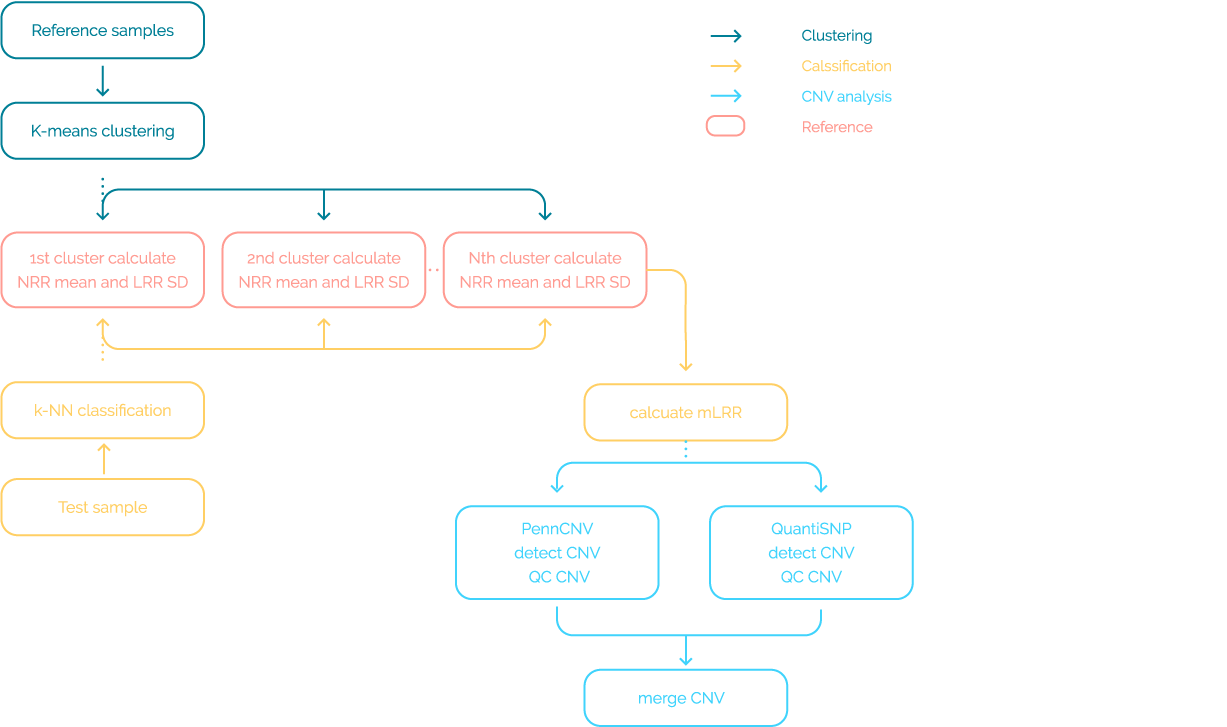
[Figure 3]. Pipeline of BEBEGENE with Genomic Wave offset.
The preprocessing used machine learning to offset the wave.
CNV analysis was performed with two tools using offset data.
CNV results were merged to reduce false negatives.
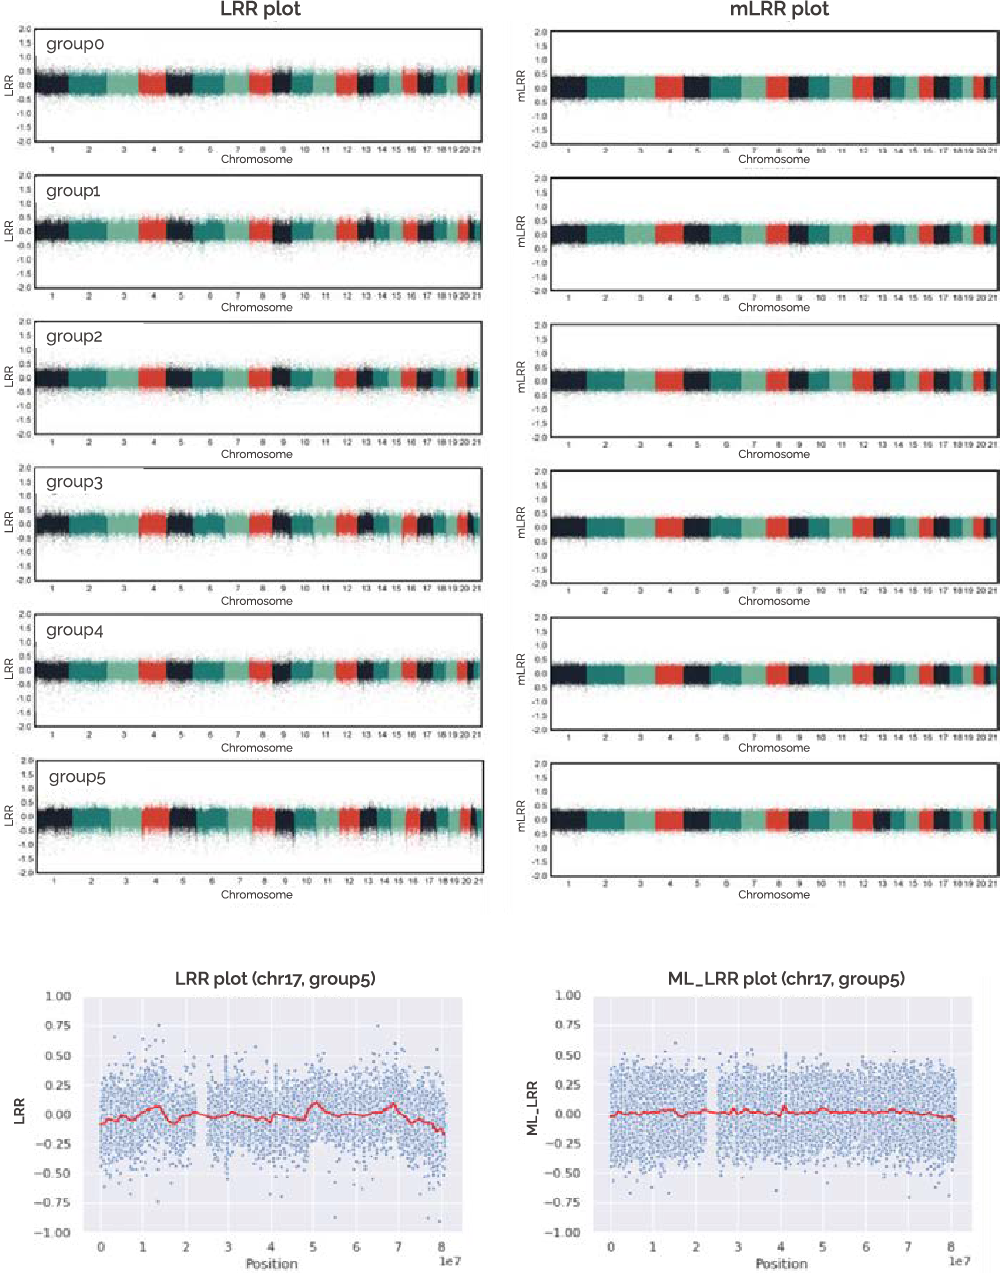
[Figure 4]. Result of waves offset.
In the result of group5, both ends of the chromosomes were
offset in the modified LRR for all chromosomes
02
Interpretation of
BEBEGENE analysis result
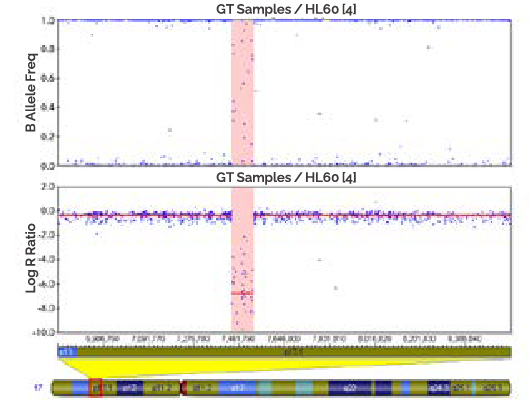
In the BEBEGENE result, the CNV is determined according to the intensity of the LRR value [Figure 5]. In addition, it can be confirmed by the distribution of BAF values. LOH can be confirmed with BAF, and mosaic can also be confirmed.
-
-
A
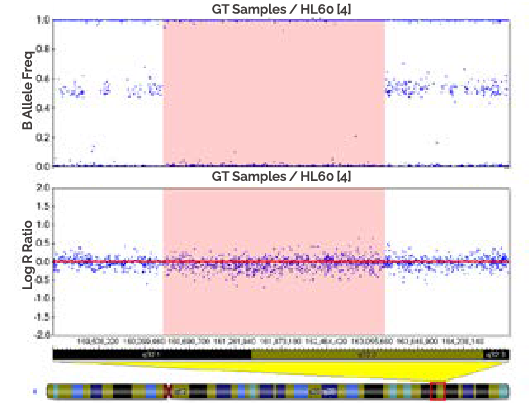
A region of homozygous is where both copies of the chromosome have been lost (shaded). In this case, there are no SNPs present, so the genotyping data (B Allele Freq plot) appears like a "waterfall" ass result of noise in the absence of signal. The log R ratio in thin region is the log2 of -0/2, which is a highly negative value and is shown in the Log R Ratio plot as a large deflection downward.
-
-
B
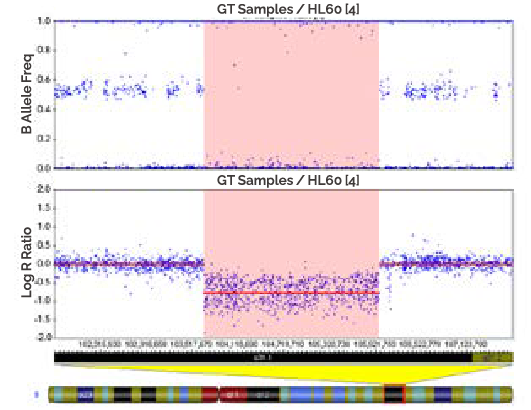
A hemizygous deletion (loss of one copy) is depicted in the ICB as a loss of heterozygotes in the B Allele Freq plot (top) and a loss of signal intensity in the Log R Ratio plot (bottom). In the region of the deletion (shaded), the log R ratio Is log2 of 1/2, or-1.
-
-
C
A region of copy-neutral LOH (shaded) is depicted by a loss of heterozygotes In the Ballele frequency dada but no change in the log R ratio (physical copy number).
-
-
D
Regions of deletion (not shaded) are depicted by loss of signal intensity in the Log R Ratio plot to -0.5. An overlapping duplication (shaded) is depicted in the middle of the window by an increase in the Log R Ratio plot.
E
[Figure 5]. Distribution of LRR and BAF by CN. The E) Copy region marked in pink is the corresponding CNV, and another region is the normal. A) homozygous deletion CN = 0, B) hemizygous deletion CN = 1, C) Loss of heterozygotes CN = 2, D) duplication CN= 3, E) Mean and SD of LRR and BAF values according to copy number. [Adapted from illumina's Technical Note]
| copy number | genotype | LRR Mean | LRR SD | BAF Mean | BAF SD |
|---|---|---|---|---|---|
| 0 | DD | -5 | 2 | NA | NA |
| 1 | A | -0.45 | 0.18 | 0 | 0.03 |
| B | -0.45 | 0.18 | 1 | 0.03 | |
| 2 | AA | 0 | 0.18 | 0 | 0.03 |
| AB | 0 | 0.18 | 0.5 | 0.03 | |
| BB | 0 | 0.18 | 1 | 0.03 | |
| 3 | AAA | 0.3 | 0.18 | 0 | 0.03 |
| AAB | 0.3 | 0.W18 | 0.33 | 0.03 | |
| ABB | 0.3 | 0.18 | 0.66 | 0.03 | |
| BBB | 0.3 | 0.18 | 1 | 0.03 | |
| 4 | AAAA | 0.75 | 0.18 | 0 | 0.03 |
| AAAB | 0.75 | 0.18 | 0.25 | 0.03 | |
| AABB | 0.75 | 0.18 | 0.5 | 0.03 | |
| ABBB | 0.75 | 0.18 | 0.75 | 0.03 | |
| BBBB | 0.75 | 0.18 | 1 | 0.03 |
EDGCName of Representative : Min-Seob Lee
Tel : +82-32-713-2100
EDGC, Inc.#143, Gaetbeol-ro, Yeonsu-gu, Incheon, 21999, South Korea Tel : +1-800-605-8422
- ⓒ[2022]. Eone Diagnomics Genome Center Co., Ltd. All Rights Reserved.
- Internal Information Management RegulationPrivacy Policy